



Understanding Pump Performance Curves: A Practical Guide


Introduction
Every so often a contractor calls in convinced they’ve been sold a faulty pump. It’s running, it’s wired correctly, nothing’s leaking — it just isn’t delivering what the spec sheet promised. Nine times out of ten, the pump isn’t broken at all. It was picked using the headline number on the box instead of the one chart that actually tells you what it will do once it’s installed: the performance curve.
If you’ve ever glanced at one of these curves and felt your eyes glaze over at the tangle of lines, you’re not alone most people who buy pumps never learn to read them properly, and most suppliers never explain why it matters. This guide walks through what the curve is actually telling you, how to read it without an engineering degree, and where it fits into a real buying decision whether you’re speccing a single booster pump or a multi-pump commercial system.
So What Is a Pump Performance Curve, Really?
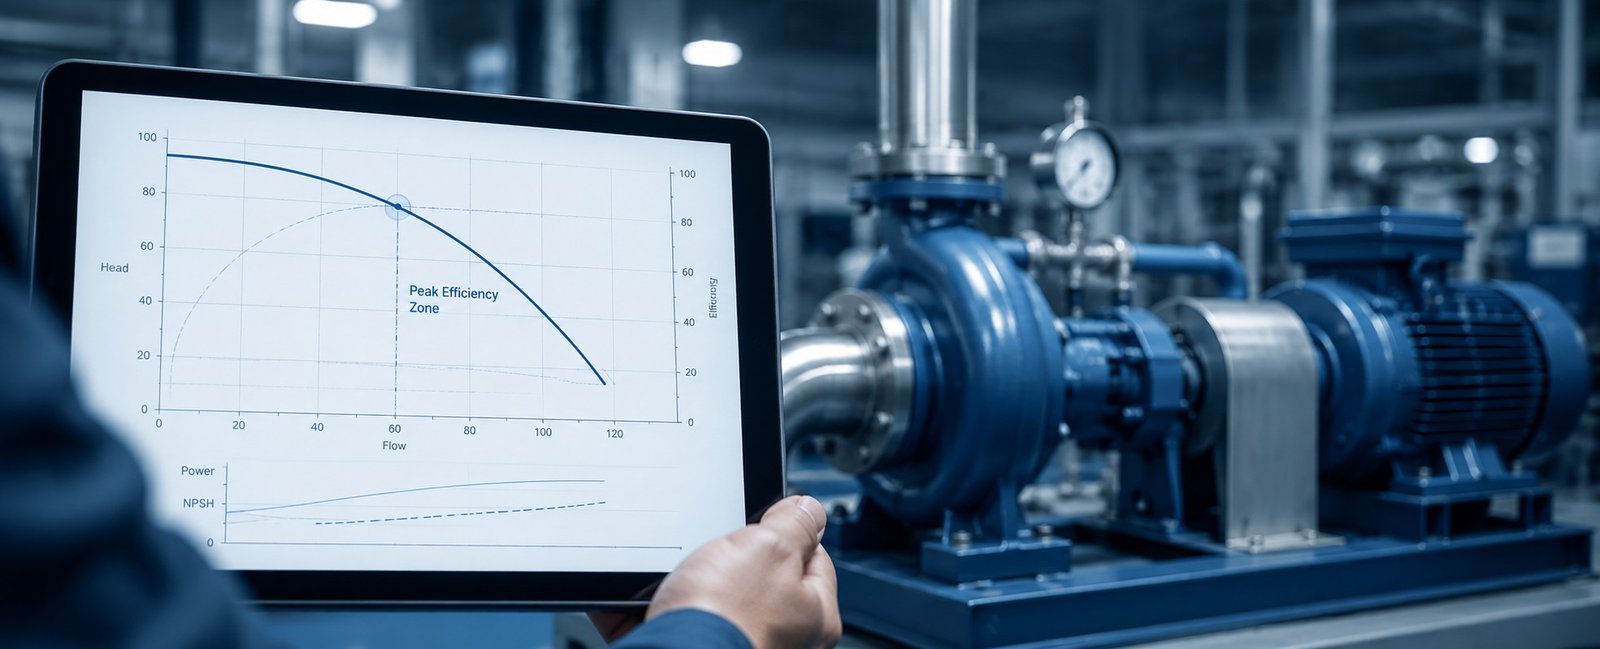
Think of it this way: a pump doesn’t have one single performance number. It has a whole range of them, depending on how hard the system asks it to work. Push more water through a narrower pipe, and the pressure it can deliver drops. Ask for less flow, and the pressure it can push climbs. The performance curve is simply the manufacturer’s map of that entire relationship, plotted on a graph rather than buried in a table of numbers.
On the chart, flow rate runs along the bottom (the horizontal axis), and head, essentially, pressure expressed as the height of water it could lift, runs up the side (the vertical axis). The curve itself slopes downward from left to right: as flow increases, head decreases. That’s true of virtually every centrifugal pump ever made, and it’s the single fact that explains most of what follows.
The Four Curves Usually Sitting on the Same Chart
Manufacturers rarely give you just the head-flow line on its own. A proper datasheet layers a few curves on top of each other, and each one is answering a slightly different question

Efficiency and NPSH are the two curves people skip past most often and, not coincidentally, the two that explain almost every mysterious pump failure that isn’t actually a manufacturing defect.
Reading the Curve Without Getting Lost
The process is simpler than the chart makes it look. Start with the flow rate your system actually needs, not the maximum it might ever see, but the number it runs at day to day. Find that point along the bottom axis, trace a line straight up until it hits the head-flow curve, then read across to the vertical axis. That’s the head the pump will actually deliver at your real operating flow.
From there, check the same flow point against the efficiency curve sitting just above or below it, this tells you whether you’re buying a pump that runs comfortably at that flow, or one that’s technically capable but working far outside its comfort zone. Do the same against the power curve to make sure the motor isn’t undersized, and — if you’re dealing with a suction-lift or deep-well setup, check that your system’s available suction pressure clears the NPSH line with some margin to spare.
The Best Efficiency Point and Why It’s Worth Caring About
Somewhere on every efficiency curve there’s a peak, the flow rate at which the pump does the most work for the least energy, vibration, and internal wear. That point has a name: the Best Efficiency Point, or BEP, and it’s arguably the most useful single piece of information on the entire chart.
A pump doesn’t have to run exactly at its BEP to work. But the further it operates from that point, in either direction, the harder its bearings, seals, and shaft are working relative to the water actually being moved. Run a pump well to the left of its BEP for years, and don’t be surprised when the seal fails early. It’s rarely a defect. It’s a pump doing a job it was never quite sized for.
Why the Pump Curve Alone Doesn’t Tell the Whole Story
Here’s the part that trips up even experienced buyers: the pump curve describes the pump. It says nothing about your specific building, your pipe run, your elevation change, or how many bends and fittings are between the pump and the tap. That’s a separate curve entirely, the system curve and it has to be plotted against the pump curve before you know anything real.
Where the two lines cross is your actual operating point. Not the pump’s rated maximum. Not the system’s theoretical ideal. The actual, physical point where your installed pump will settle once it’s running. Skip this step, and you can end up with a pump that’s perfectly rated on paper and still delivers the wrong flow once it’s bolted into place.
What Happens When You Add a VFD Into the Picture
A growing number of commercial and industrial systems now pair pumps with variable frequency drives rather than running them at a single fixed speed. This changes the curve conversation slightly, because a VFD doesn’t just turn a pump on and off, it shifts the entire curve up or down depending on the speed it’s running at.
The relationship follows what’s known as the affinity laws: flow changes roughly in proportion to speed, head changes with the square of speed, and power changes with the cube of speed. In plain terms, slow a pump down by 10%, and you don’t just save 10% on power. You save considerably more, because power drops off much faster than speed does. This is exactly why VFD-paired systems are worth the extra cost on larger installations: the curve doesn’t just move, it moves in your favor on the electricity bill.
Running Pumps in Parallel or Series
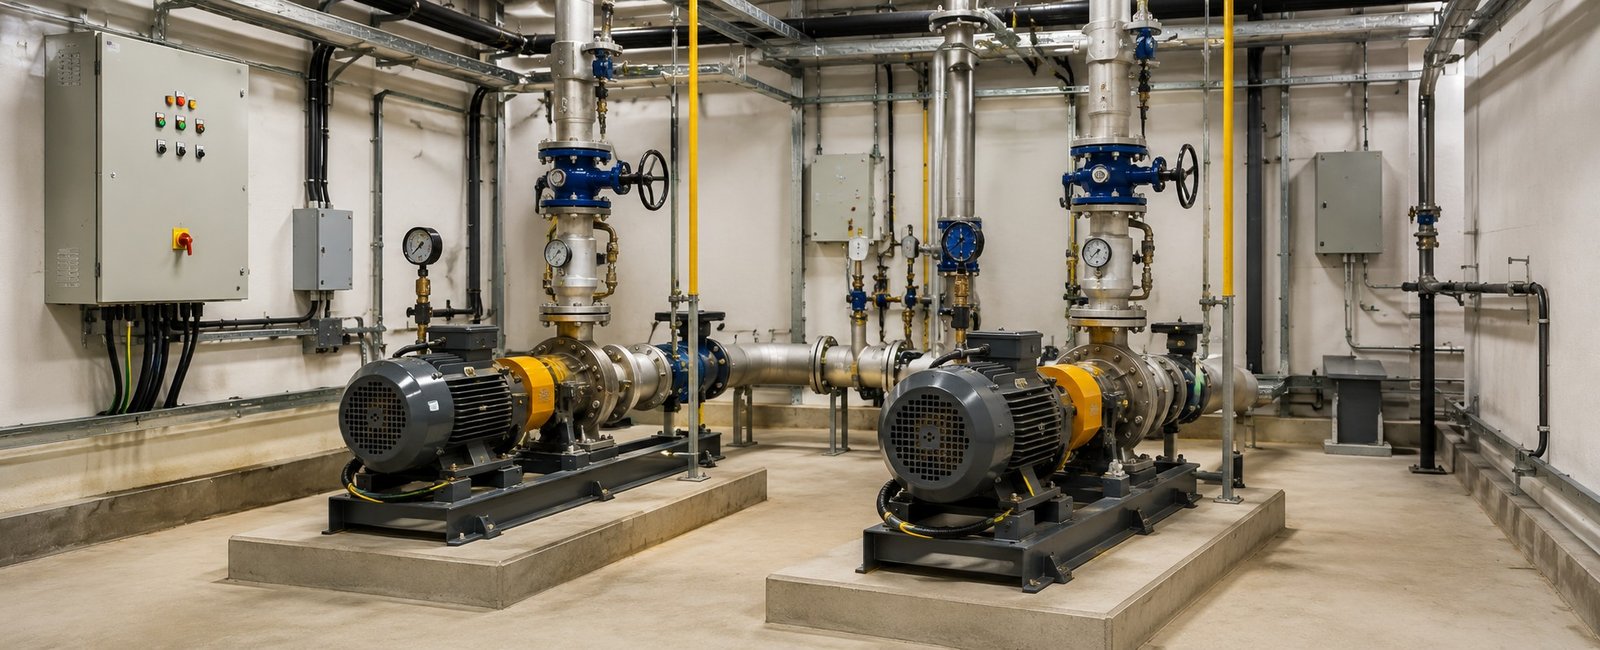
On larger commercial and industrial jobs, a single pump curve sometimes isn’t the end of the story either. Two identical pumps running in parallel combine their flow at a given head, useful when a system needs more volume than one unit can deliver, and it’s also how redundancy gets built in, since one pump can keep the system running if the other needs maintenance. Run pumps in series instead, and their head adds together at a given flow the approach used when a system needs to push water further or higher than a single pump’s curve allows, such as multi-storey pressure boosting.
Both setups still come back to the same fundamental reading skill: know your required flow and head, then check where the combined curve not just one unit’s curve actually lands.
A Worked Example, With Real Numbers
Say a building’s plumbing system needs 30 m³/hr at 25 meters of head, once pipe length, fittings, and elevation to the highest fixture are all accounted for. A pump datasheet advertising “up to 45 m³/hr” looks like more than enough headroom. But that 45 m³/hr figure is almost always measured at zero head, the pump running wide open, against no resistance at all, which never happens in a real installation.
What actually matters is where the curve sits at 25 meters specifically. If the chart shows only 22 m³/hr available at that head, the pump is undersized for the job despite the more impressive number printed on the box. This is the exact gap that shows up later as a project delay or a failed pressure test, and it’s entirely avoidable at the point of selection, before any money has changed hands.
Common Mistakes Worth Naming
- Buying off the maximum flow figure instead of checking head at the flow the system actually needs
- Never plotting the system curve, a pump curve on its own tells you what’s possible, not what will happen
- Running a pump consistently far from its BEP and being surprised when seals or bearings wear early
- Ignoring NPSH margin on suction-lift or deep-well jobs, still one of the more common causes of avoidable cavitation damage
- Assuming a similar-looking model shares the same curve — curves are specific to the exact model and impeller size, not the product family as a whole
What to Ask Your Supplier Before You Buy
A good supplier should be able to hand you the actual curve for the specific model and impeller size you’re buying, not a generic brochure figure. A few questions worth asking directly:
- Can you provide the curve for this exact model and impeller diameter, not just the product family?
- What’s the BEP flow rate, and how close does it sit to my system’s actual operating flow?
- What NPSH margin do I have at my required flow, given my actual suction conditions?
- If I’m using a VFD, can you provide the curve at reduced speed, not just full speed?
If a supplier can’t answer these, or can only offer the headline spec-sheet numbers, that’s usually a sign the pump hasn’t actually been matched to your system — just picked off a catalogue.
A Quick Glossary, for Reference
- Head: The pressure a pump generates, expressed as the height of a water column it could theoretically lift, usually in meters.
- Flow rate (Q): The volume of water moved per unit of time, typically m³/hr or liters/minute.
- BEP: Best Efficiency Point, the flow rate where the pump runs most efficiently with the least mechanical stress.
- NPSH: Net Positive Suction Head, the minimum suction pressure required to avoid cavitation.
- Cavitation: Vapor bubbles forming and collapsing inside a pump due to insufficient suction pressure, causing pitting and noise.
- System curve: A plot of the resistance your actual pipework, fittings, and elevation create across different flow rates.
- Affinity laws: Formulas describing how flow, head, and power change as pump speed (via a VFD) is adjusted.
Where This Fits Into a Real Buying Decision
For MEP contractors and specifiers, this is really what separates comparing spec sheets from making an actual engineering decision. The same flow-and-head logic underpins the sizing guidance in our water pumps for construction projects guide, where dewatering, transfer, and plumbing-support pumps are matched to a project’s different phases using exactly these numbers.
If you’re still deciding between pump categories before curve analysis even comes into it, our breakdown of booster pump vs. centrifugal pump and our guide to the difference between single-stage and multistage pumps are worth reading first, since curve shape differs meaningfully between these types.
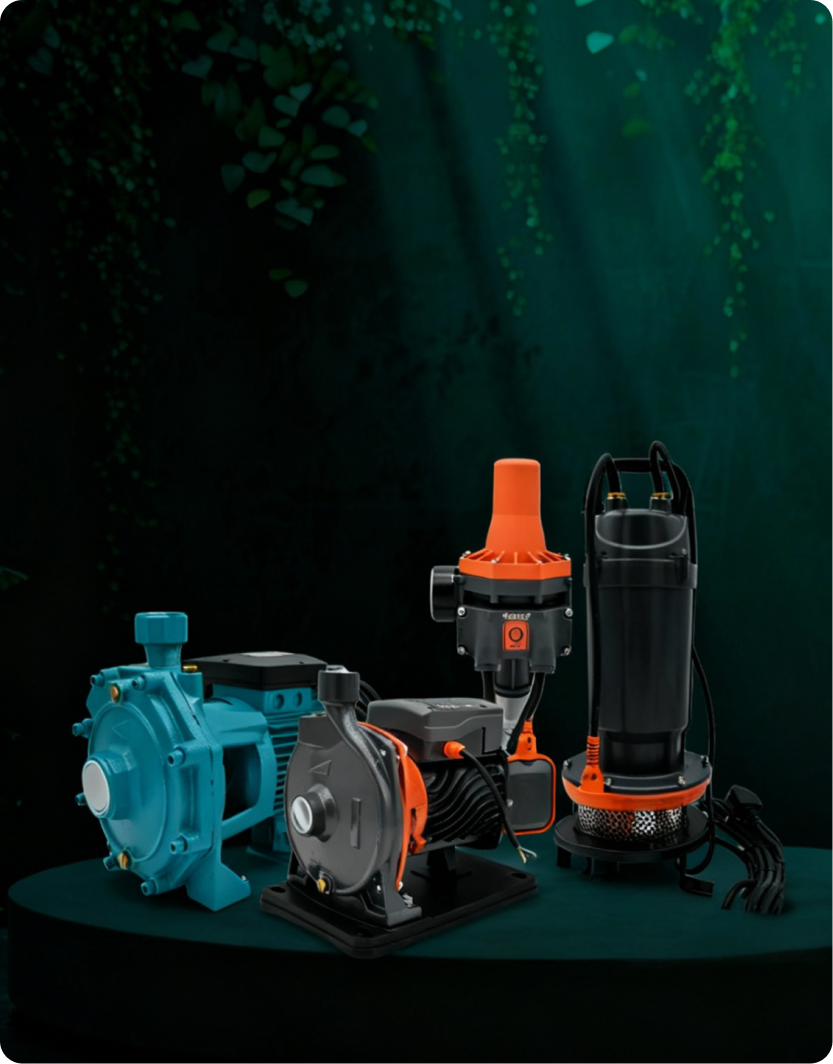
You can review performance specifications directly on our centrifugal pump range, and for larger commercial or industrial jobs, our industrial water pump supplier page covers sizing and reliability support for facility and project engineers.
Frequently Asked Questions
- What’s the difference between a pump curve and a system curve?
A pump curve shows what a specific pump is capable of across its flow range. A system curve shows the resistance your own pipework and installation create at different flows. Where the two cross is your real, physical operating point not either one in isolation. - What is the Best Efficiency Point, and do I have to hit it exactly?
It’s the flow rate where the pump runs most efficiently with the least mechanical stress. You don’t need to hit it exactly, but the closer your actual operating flow sits to it, the longer the pump tends to last and the less it costs to run. - Why does a pump with a higher rated flow sometimes underperform mine?
That headline figure is usually the flow at zero head, no resistance at all. Once connected to a real system, what matters is the flow available at your actual head requirement, which is often noticeably lower than the number printed on the datasheet. - Does adding a VFD change the pump curve?
Yes, a VFD shifts the entire curve based on running speed, following the affinity laws. Slowing a pump down reduces flow, head, and power all together, with power dropping off fastest of the three. - What is NPSH and when should I actually worry about it?
Net Positive Suction Head is the minimum suction-side pressure a pump needs to avoid cavitation. It matters most on suction-lift and deep-well installations, where the water source sits below or far from the pump. - Can I run two pumps together instead of buying one larger unit?
Yes, pumps in parallel add flow at a given head, useful for extra volume and redundancy. Pumps in series add head at a given flow, useful when water needs to travel further or higher than one unit can manage alone.
Specify With Confidence, Not Just a Spec Sheet
A performance curve isn’t manufacturer paperwork you can skip past. It’s the actual difference between a pump that meets its spec sheet and one that performs correctly once it’s installed in your building or on your site. Read against your real operating point — not the pump’s best-case number — and most of the mismatches that show up later never happen in the first place.
Need Help Matching a Pump Curve to Your System?
Share your required flow rate, head, and duty cycle, and our team will help confirm the right pump model and curve match for your project within 24-48 hours.
- Request a Quote (RFQ form) through our Webiste
- WhatsApp: +966 54 750 9351







Comments
No comments yet. Be the first to comment!